Time Spent Near Gateway Report
A Report on How Long Bluetooth Tags Were Near Each Gateway Device
Table of Contents
Time Spent Near Gateway
This is a report that gives a user the total duration that a tagged asset is picked up by devices that are set up as gateways for Bluetooth® tags. The report knows the duration of how long a tag is near a gateway by keeping track of the times between tags being ‘found’ and ‘lost’. Devices can be set up as BLE gateways and used to keep track of tagged assets on TG, by making assets of these tags.
How Does it Work?
With a gateway device configured to generate ‘lost’ and ‘found’ events as well as tag list updates in between, the report will attempt to chain together time-blocks of continuous tag detection. These time-blocks are then measured and subtotalled within the report. The same gateway can have several time blocks throughout the day and they will be subtotalled together for the report. The system is robust in the event of a missing event or two, and always resets at midnight local time according to the gateway. Please see the diagram below for several scenarios. The colours of the dots indicate the gateway.

The report is grouped by date as seen in the images to follow. The Bluetooth® Tag Asset Tracking Report may serve several critical functions within an organization, such as:
Enhanced Asset Management: By monitoring the duration for which tagged assets remain near gateways, organizations can effectively track asset movements and locations. This capability is essential for managing high-value or mission-critical assets that require continuous oversight.
Operational Efficiency: The report provides insights into asset usage and movement patterns, facilitating the optimization of operational workflows. This leads to reduced search times for assets and minimized operational downtime.
Security and Loss Prevention: Continuous tracking of tagged assets helps prevent misplacement or theft. The report can highlight anomalies, such as assets being moved outside designated zones or being inactive for extended periods, enabling prompt corrective actions.
Regulatory Compliance and Auditing: In industries with stringent regulatory requirements, such as healthcare and logistics, this report provides an auditable trail of asset locations and durations. It supports compliance efforts and aids in conducting thorough internal audits.
Resource Optimization: Detailed asset usage data allows organizations to make informed decisions regarding resource allocation. Underutilized assets can be reallocated to areas with higher demand, improving overall efficiency.
Cost Reduction: Effective asset tracking leads to significant cost savings by reducing redundant asset purchases, preventing losses due to theft or misplacement, and ensuring optimal utilization of existing assets.


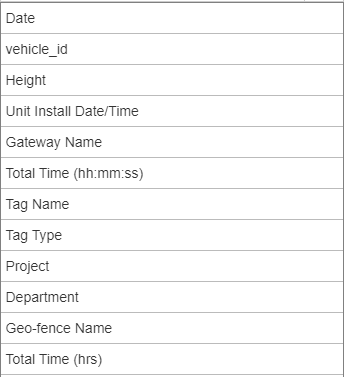
The following list is a list of data that can be added as columns in the report:

This means that you can do useful things such as add a Tag Name to see how much of time a tag has spent near a gateway. Specific use cases that this type of report can help with involve:
- Monitoring the working hours for workers carrying tags
- Monitoring how long vehicles are parked in a parking lot for billing purposes
- Ensuring only allocated assets are in certain authorized areas
Next Steps
For more information on tags, please see Tags in Telematics Guru.
